Login
Signup
Masai Water Supply And Irrigation Project
- Home -
- Masai Water Supply And Irrigation Project
Masai Water Supply and Irrigation Project
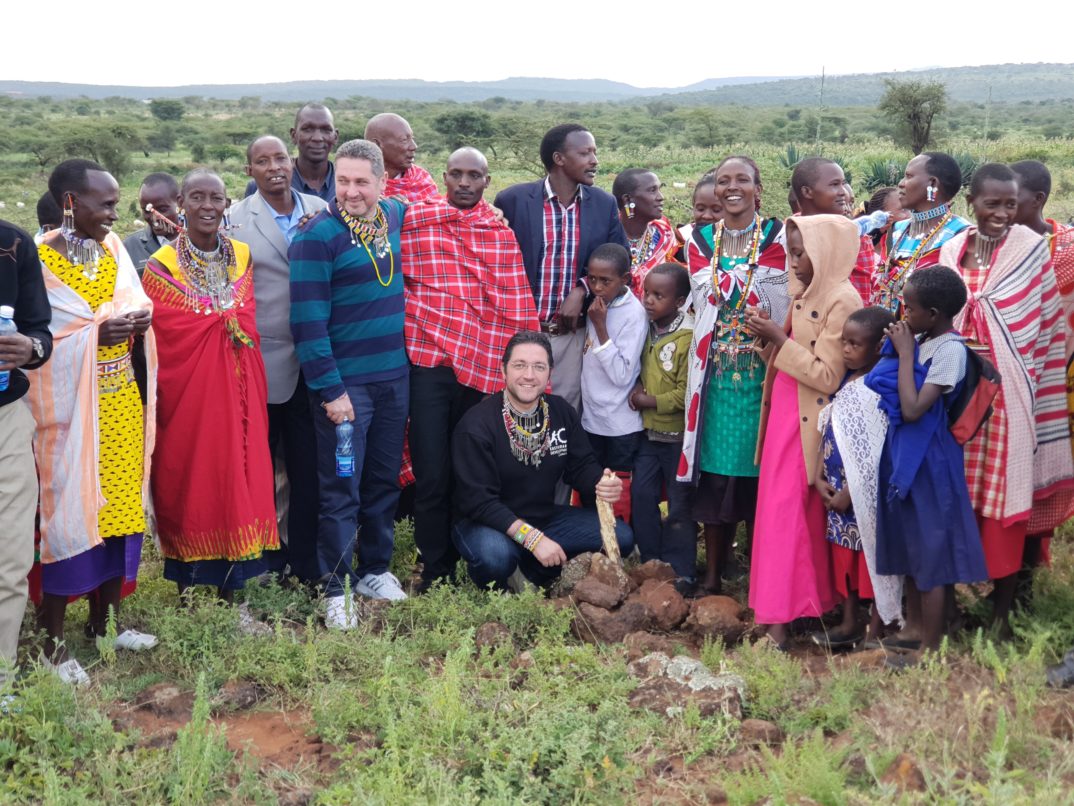
the Masai tribe in Saikeri/Kenya uses a rainwater collection point for drinking . The water collected in that spot causes severe diarrheal diseases because of contamination with cholera and typhoid bacteria, what led to several deaths. Masai people have to spend hours on the road to get some water to survive. When no water is available in the area, the burden of bringing water falls disproportionately on women and children. ESPECIALLY ON GIRLS! The loss of time for water collection prevents children from attending school. For the Masai tribe in Saikeri, Kenya, we have developed a solar-powered water supply system to supply drinking water to 35,000 people, 100 cows, 300 goats, 700 sheep. In connection with food security, an additional planned farming project is going to be applied. This should also be operated separately via the water supply system with a drip irrigation technique. Access to water for personal care, crafts, cooking, drinking, livestock farming and agriculture makes it easier to live and improve the quality of life in the region. Poverty can thus be tackled sustainably.
BACKGROUND INFROMATION
Site Location and soil type
The proposed borehole site lies nearer to the southeast of Saikeri Trading centre some 1.0km away from the main road from Ngong Town – Kimuka – Saikeri shopping centre which is 23km to the west of Ngong Township within Olkuraru village of Ntashart location Ewaso Kendong and the borehole site located on Topographic Map Sheet No. 148/3: NGONG SHEET on a scale 1:50,000 cover the project plot on approximate coordinates of the site No 01 at an elevation of 1641metres above sea level measured by GPS.
Easting: 37M 0228733; Northing: UTM 9844522 and Elevation: 1641 amsl
The access to the site is through Ngong Township from Nairobi and then to the road to Kibuku Centre that lies on the outskirts of Ngong Township on to the road to Saikeri Market Centre. The site lies approximately 23.0 kilometres to the west Ngong Township off to the right on murram road past Kimuka PCEA Church PCEA Kimuka Girls High school, and branches off to the road to Saikeri located 13km from Kimuka and turn to the left of the sign post of ICROSS/MOH for Paul’s Clinic at Ilkiloret area and then turn after the steppe hill to the left before Saikeri Market Centre to the client homestead located approximately 1.0km away from the road to Saikeri market.
Physiography
The project site falls within the Ngong Hills physiological unit to the west of Nairobi City. These hills comprising mainly of the north – south trending ranges extend westwards to the height of 2020 metres amsl. The main drainage is easterly in the direction from elevation of the Ngong Hills settings. The rivers flowing from the western part of Ngong discharge moderate flow into the flat pene-plains – that taper to from the EWASO west of Ngong. In the high grounds of the well-defined Ngong catchments, due to scanty forest cover as water storage area fails to ensure high flows in the rivers.
The topography of the land lies on a sloppy terrain. There is NO permanent river that drains the area from the Ngong Hills in the vicinity of the project area except dry rivers beds.
Rainfall, Climate and vegetation
The area displays a bi-modal rainfall pattern distribution with roughly equal maxima in March/April and November/ December and is evenly distributed in the area and the environs. The mean annual average rainfall ranges at about 900mm part of which percolates into the ground and the rests is run-off to the nearest distributaries of the river. The vegetation cover consists of low grasses mainly during rain seasons and indigenous thorny acacia trees.
Water Sources
Currently water for domestic use is obtained by supply from water tankers from the neighbours, whose water supply is intermittent and inadequate, and consequently unreliable. The feasible alternative water supply in the project area is available except dirty and polluted water pans. The client therefore wishes to drill a borehole in order to have a reliable source of water and it is estimated that he would require 30 cubic metres per day for domestic use as well as minor irrigation.
GEOLOGY
Local Geology
The geology of the area comprises of a succession of lavas and pyroclastics of the Cainozoic Age overlying a foundation of folded Precambrian schist’s and gneisses of the Mozambique Belt. The Cainozoic Volcanics rocks comprising of Ngong Basalts, Oldoinyo Narok Agglomerates, Kandizi phonolites, Nairobi Trachytes and Mbagathi Trachytes, in that order of stratigraphic succession. These rocks overly the Basement System rocks at considerable depth, consisting of mainly gneisses and schists, which have been formed as a result of intense pressure and thermal activity over a long time. The later rock formations are quite deep in the area. The lavas and pyroclastics originate from the fissures eruption during the development of the Rift Valley System. The area underwent pene-planation during the period between the Precambrian and the Tertiary times.
The Ol Donyo Narok agglomerates overlies the Kandizi phonolites further westwards. The area is covered by greyish to reddish soils, which are underlain by Kandizi phonolites, Trachytes and tuffs of the Upper Athi Series, Kapiti Phonolites, gneisses of the Basement System, in that stratigraphical sequence. The Mbagathi Trachytes are relatively the youngest rocks in that sequence.
The lavas are intercalated by various layers of Old Land Surfaces (OLS). These are erosion layers formed between successive lava flows, which sometimes includes alluvial deposits that may be of water bearing.
A major fault traverses the area just north of the project area are mostly north east to south west direction has a northerly down-throw.
The geology of the project area is described in “Geology Report of the Nairobi Area” by E. P. SAGGERSON, 1991.
The Cainozoic Volcanic rocks
The Cainozoic rocks which were derived from the Rift Valley system, consists of a thick succession of alkaline lava and associated tuffs that began accumulating in the Mid-Miocene and continued into the Upper Pleistocene.
The main lava thins in an easterly direction, the limits being marked by erosion scarps forming the walls of the more resistant lava sheets. Maximum accumulation is at the peak of the Sub-Miocene erosion surface into the Rift.
Recent Deposits
The lavas and tuffs on weathering have been altered to pale brown or reddish ferruginous soils (laterites) and ferricrete (murram). The soils are in the area are reddish friable clays with thickness very low.
Kerichwa Valley Series
The Kerichwa Valley Series, which are pumice rich formation with ash, resulted from explosive eruptions over a short interval of time. They, however can be traced to any particular volcanic vent in the Rift Valley and that they are the result of the rapid pressure release along the fissures following the Rift faulting and graben-forming collapse.
The deposits of the series buried a pre- existing landscape, the former valleys being composed of Trachytes. The series represented by the sediments, tuffs and welded tuffs. The tuff, which may be partly re-worked, consists of thickly bedded, impermeable strata. Thin bands of very weathered pebbles and sandy materials, which are probable aquifers maybe, found between the impermeable strata. The tuffs and the sediments are thin in the area to contribute in terms of groundwater availability.
Kandizi phonolites
Kandizi phonolites closely resemble the Nairobi phonolites but are more leucocratic, contain greater proportion of feldspar, and have conspicuous nepheline and biotitie that are characteristic lacking in Nairobi phonolites. The rock is generally dark blue to black, of compact and granular appearance, though occasionally exhibiting vesicular and flow structures suggesting that it has been derived from the flow to the west. The Kandizi phonolites occur near the Kandizi quarries on the Nairobi – Magadi road and are overlie by both the Ngong lava and the Kerichwa Valley tuffs
Ngong Lava
These are the oldest Ngong lava that occurs between Nairobi Trachytes and Kandizi phonolites. These lavas are dense, blue black rocks that forms suite of alkaline lavas ranging from ultra basic to basic in character.
Upper Athi Series
The inter-stratified coarse sediments, gravels, tuffs and welded tuffs, and clayey materials in fine-grained matrix characterize these sediments. This indicates that the outpouring of the Trachytes was accompanied by the deposition of the sub-aerial tuffs, probably as a result of the volcanic activities in the Rift Valley. The thickness of this series increases westwards, but has not been accurately been established in the area.
Mbagathi Trachytes
The Mbagathi Trachytes is significantly part of the Upper Athi Series. The formation is of porphyritic lava with feldspar insets
Precambrian Basement System Rocks
The Precambrian rocks of the area have been inferred (from areas it is exposed especially Athi River Area) to be represented by layered fine grained schist’s and coarse-grained gneisses that have been invaded by pink quartzo-feldspatic pegmatite. Biotite garnet – epidotic gneisses, hornblende and quartz-feldspar are abundant. The interface between the Precambrian and the overlying volcanic rocks contain a layer of gneissic rubble derived from the gneisses through weathering as well as clays, sans and dendrites, indicating a period of erosion prior to the deposition of the underlying volcanic rocks upon undulating surface cut across the crystalline formation.
WATER RESOURCES
Surface Water Resources
There is NO surface water in the locality except dry valleys and seasonal water pans.
Groundwater occurrence
A perched water table occurs above the Ngong basalts while the Kerichwa Valley tuffs behave like a sponge and the contact between these rock formations and the underlying impermeable phonolites forms a perfect aquifer. There are a number of aquifers that maybe encountered during drilling, either in fluviatile or lacustrine deposits, intercalated in most formations or between the principal lava, also referred as ‘Old Land Surface’ (that is erosion layer formed between successive lava flows – sometimes including alluvial deposits which although as permeable as fractured zones, are usually water bearing). The harder volcanic rocks, especially the welded tuffs and Trachytes and or fractured, yield little or no water due to their generally impervious character. Other good aquifers are expected in the faults, fissures and open joints in the volcanic rocks.
The regional groundwater aquifer system in the area is inter-connected through a network of fissures and porous material which partly composes the Old Land Surface deposits.
Most of the aquifers in this area are confined and from the available records, it is observed that more than one aquifer have been struck in the inter-volcanic and fractured/weathered zones within the volcanics. The yield of boreholes increases with depth within these rock formations, with water being struck at various levels.
Groundwater occurs in different rocks depending on the geological conditions, physiographic nature of the area, the permeability and porosity of the rock formations and the weathering and fracturing of the rocks.
Water can exist in aquifers (water bearing formations) under two completely different conditions namely, confined and unconfined aquifers. Confined groundwater is isolated from the atmosphere at the point of discharge by impermeable geologic formations while the unconfined aquifer is generally subject to pressures higher than the atmospheric pressure.
An aquifer performs two important functions namely storage and conduit. The interstices of a water bearing formation act as storage sites and are part of a network of conduits. Groundwater is constantly moving through these conduits under the local hydraulic gradient. Thus water contained in any aquifer is in temporary storage and if not used will be discharged as springs, streams, rivers, lakes and oceans.
HYDROGEOLOGY
Recharge Considerations of Groundwater
The quantity of groundwater of any given area depends on the recharge potential of the aquifers. The mechanism of groundwater recharge and rate of replenishment will depend on the soil structure, vegetation cover and the erosion state of the parent rock. The primary recharge source of the aquifer in the project area is lateral flow from the catchments area located west of the project area, mainly from the Ngong Hills. Secondary replenishment of the aquifer is through infiltration and percolation of the annual average precipitation through open fissures to the aquifer zones. The annual average rainfall in the area is about 900mm, part of which is expected to recharge aquifers after evapo-transpiration deductions.
The movement of groundwater is therefore controlled by the sub-surface morphology of the volcanic rocks. Weathered and/ or fractured zones as well as buried valleys, faulty zones and joints are preferred media for groundwater movement.
Existing Boreholes
Several boreholes have been developed in similar geological conditions in Ngong area and indeed in the vicinity of the project area. These boreholes (Table below) exhibits varying degree of success and this can be attributed to their total depth, topographical location, construction design and the mode of development. The recorded yields are sometimes not the correct discharge of those particular boreholes since they were not fully tested. It is noted that deeper boreholes which have struck several aquifers within the Upper Athi Series and whose depth of pump intake deeper have better yields.
Borehole data plays an important role in the evaluation of groundwater prospects for a given region as to whether geophysical exploration methods have been used or not.
A few boreholes have been drilled within the study area at far places. The data of these boreholes is tabulated below drilled in the vicinity of the proposed borehole.
The borehole to be drilled in area is expected to be successful.
| Borehole
Number/ (C) |
Borehole Name/Owner | Distance (Km)/Bearing | Total
Depth (m) |
Water
Struck Level (m) |
Water
Rest Level (m) |
Pumping water level (m) | Tested
Yield (m3/hr) |
Year drilled |
| No Number | Saikeri Community water project | 1.1km/NW | No data | No data | No data | No data | Operational | 2008 |
| No Number | Kimuka | 12/SE | No data | No data | No data | No data | Operational | 2010 |
| No Number | ENKMA Farm | 1.2/NW | No data | No data | No data | No data | Operational | 2012 |
| No Number | Caleb Wanjala Natembea | 2.0/NW | 280 | No data | No data | No data | 30.0 | 2016 |
The results from the existing boreholes have varying discharge values depending on the location drilled and depth of the borehole as well design and borehole construction.
The expected yield of the borehole is therefore expected to be more than 10m3/hr and there are chances of striking an aquifer with fresh soft and alkaline water that is well mineralised as per the geophysical and hydrogeological interpretations.
Analysis of the Aquifer and Groundwater
An estimate of the availability of the groundwater in storage beneath an area requires determination of the groundwater basin boundaries, both vertical and horizontal, and of the aquifer dimensions and characteristics. Such an analysis requires careful and accurate aquifer characteristics, GIS techniques that indicates the extent of the aquifer in question and accurate pump testing of to determine the capacity of the aquifer(s). In addition recharge ad discharge must be fairly be quantified. To determine the groundwater reserve in the present situation is almost impossible.
6.4 Specific Yield
The quantity of water that a unit volume of the material will give up when drained by gravity is called Specific Yield. Due to lack of specific aquifer tests, specific yields are difficult to determine. However, studies have been carried out on specific yields of various geological materials, which give indications of specific yield ranges (Table ll) for selected Earth Materials (Driscoll 1986).
Specific Yield ranges
| Ite | Earth Material | Specific Yield % |
| 1. | Clay | 1 – 10 |
| 2. | Sand | 10 – 30 |
| 3. | Gravel | 15 – 30 |
| 4. | Sand and Gravel | 15 – 25 |
| 5. | Sandstone | 5 – 15 |
| 6. | Shale | 0.5 – 5 |
| 7. | Limestone | 0.5 – 5 |
In the Project Area, the main aquifer is expected mainly of sandy sediments and gravel of the phonolites contacts of the Old Land Surface. The Specific Yield of these aquifer materials therefore falls in the 15 – 25% range. It is therefore expected that the borehole shall be successful.
Hydraulic conductivity (K)/GroundwaterFlux
Up to now, hydraulic conductivity and groundwater flux can only be accurately determined by time- consuming and expensive methods like pumping tests or sampling, isotope methods and laboratory investigations. The results are confined to few locations, and they depend on the scale of the investigation method. Measurements on rock samples in the laboratory can differ significantly from well test result. However, a simple estimation of hydraulic conductivity can be derived from the formula T= kD which can be rearranged to k=T/D, where k is the hydraulic conductivity, T is the transmissivity, and D is the aquifer thickness. A drawback to this estimation in this case however is the cumulative aquifer thickness which is recorded at the strike point rather than as an interval.
For the sake of calculations, the aquifer thickness throughout the area is assumed to be 30m. On the other hand, groundwater flux can be estimated using the Darcy’s formula of Q = T.i.W, where T is the transmissivity of the borehole, is the gradient and W the width. The slope, i is calculated from the hydrostatic head difference between two boreholes, i = h2– h1/L, where L is the distance between the two boreholes inmetres.
W is taken to be a width of 1km or 1000m.
Table: Hydraulic conductivities of typical geologic material (Bear, 1972)
| K (m/day) | 105 | 103 | 102 | 10 | 1 | 10−1 | 10−2 | 10−3 | 10−4 | 10−5 | 10−6 | 10−8 | 10−10 | ||
| K (ft/day) | 106 | 104 | 103 | 100 | 10 | 1 | 0.1 | 0.01 | 0.001 | 0.0001 | 10−5 | 10−7 | 10−9 | ||
| Rel.
Permeability |
Pervious | Semi-Pervious | Impervious | ||||||||||||
| Aquifer | Good | Poor | None | ||||||||||||
| Well Sorted
Gravel |
Well Sorted Sand or Sand
& Gravel |
Very Fine Sand, Silt, Loess, Loam | |||||||||||||
| Unconsolidated | |||||||||||||||
| Unconsolidated Clay & Organic | Peat | Layered Clay | Unweathered Clay | ||||||||||||
| Highly Fractured Rocks | Oil ReservoirRocks | FreshSandstone | Fresh |
Fresh Granite |
|||||||||||
| Consolidated
Rocks |
|||||||||||||||
Impact on the water quality
The quality of the groundwater will depend mainly on the host rock and to some extent, the design of the borehole. As a rock is an assemblage of minerals which dissolve at different rates, the resulting water quality will be determined by a competent laboratory. However, impacts from external sources can be avoided by constructing 7m deep cement grouting around the casing to prevent saline water seepages which can cause water pollution to the deep aquifer.
GEOPHYSICAL INVESTIGATIONMETHODS
A great variety of geophysical methods are available to assist in the assessment of geophysical subsurface conditions. In the present resistivity survey (also known as the geo-electrical method) was used.
ResistivityMethod
Vertical electric sounding (VES) were carried out to probe the condition of the subsurface and to confirm the existence of deep groundwater. The VES investigates the resistive layering below the site of measuring. This technique is described here below.
Basic Principles
The electrical properties of the rocks in the upper part of the earth’s crust are dependent upon the lithology, porosity and the degree of pore space a saturation and the salinity of the pore water. Saturated rocks have lower resistivity than unsaturated ones and dry rocks. The higher the porosity of the saturated rocks, the lower its resistivity and the higher the salinity of the saturated fluids, the lower its resistivity. The presence of clays and conductive minerals also reduces the resistivity of the rock.
The resistivity of the earth material can be studied by measuring the electrical potential distribution produced at the earth’s surface by electric current that passes through the earth.
The resistanceR of a certain material is directly proportion to its length L and cross-sectional area A,
expressed as
R =k*L/A (Ohm) (1)
where k is known as the specific resistivity, and is characteristic of the material and independent of the shape or size. Apply Ohm law
R=δV/I (Ohm) (2)
where δVis the potential difference across the resistor and I is the electric current through the resistor. The specific resistivity may be determined by:
k=(A/L)*(δv/I) (Ohm.m) (3)
Vertical Electrical Sounding(VES)
When carrying out resistivity sounding, current is led into the ground by means of electrodes. With two other electrodes, situated near the centre of the array, the potential field is generated by the current is measured. From the observation of the current strength and the potential difference and taking into account the electrode separation, the ground resistivity can be determined.
While carrying out the resistivity sounding the separation between the electrodes is stepwise increased (in what is known as Schlumberger Array), thus causing the flow of current to penetrate greater depths. On plotting the observed resistivity values against depth on a double logarithmic paper, a resistivity graph is formed which depicts the variation of resistivities with depths.
This graph can be interpreted with the aid of computer program and the actual resistivity layering of the subsoil is obtained. The depths and resistivity values provides the hydrogeologist with information on the geological layering and thus the occurrence of groundwater.
When carrying out a resistivities sounding, an electric current is led into the ground by means of two electrodes and the potential field generated by the current is measured. The separation between the electrodes is step-wisely increased (Schlumberger Array), thus causing the flow of current to penetrate greater depths.
The ability of a rock to conduct electrical current depends on three factors:
- The amount of open spaces between the particles(porosity)
- The degree of interconnection between these open spaces and theirvolume
- The conductivity of the water in thepores
The presence of water and its chemical characters are the principle controls on the flow of the electrical current since most rock particles are very poor conductors of electrical current (high resistance). Thus resistivity decreases as porosity, water content, hydraulic conductivity and water salinity increase. Fresh compact rocks have high resistivity than saturated sand or gravel.
By evaluating the resistivity values, an understanding of the subsurface materials can be developed. This method is especially useful for estimating the depths to the water bearing strata or estimating the thickness of selected formations.
Geophysical Field Work and Results
Fieldwork was carried out on the 29thJune 2018, where two Vertical Electrical Soundings (VES) were carried out in the client’s parcel of land at selected points at the following location:
- Site No 1 at VES 01 –located at mid of shamba nearer the manyatta at the followinglocation, whose coordinatesare
Easting: 37M 0228733; Northing: UTM 9844522 and Elevation: 1641amsl
- Site No 2 at VES 02 –located at lower section of shamba at the following location, whose coordinates
Easting: 37M 0228604; Northing: UTM 9844416 and Elevation: 1635mamsl
The geophysical data for the four Vertical Electrical Soundings obtained from the field probed to the depths of 250metres for site No 01 while site No 02 was probed to depth of 320 metres has been interpreted using computer software and the results of which the applied to interpret the respective resistivity as tabulated as follows.
Field data SITE No 1 at VES 01 – located at mid of shamba nearer themanyatta
Graph and Table for Vertical Electrical Sounding (VES 01) and Geophysical Data Interpretation
| VERTICAL ELECTRICAL SOUNDING (VES) MR KUDATE OLOLCHOLOI NKUKU NEARER THE MANYATTA MID OF SHAMBA AT OLKURARU IN SAIKERI AREA OF ENTASHART LOCATION WITHIN KAJIADO WEST SUB-COUNTY – VES 01 | ||||||
| MN/2 | AB/2 | k | d V/I | ρ (Resistivity) | AB/2 | ρ (Resistivity) |
| 0.5 | 1.6 | 7.257073 | 9.36 | 67.9262 | 1.6 | 67.9262 |
| 0.5 | 2 | 11.78096 | 4.65 | 54.78148 | 2 | 54.78148 |
| 0.5 | 2.5 | 18.84954 | 2.85 | 53.72119 | 2.5 | 53.72119 |
| 0.5 | 3.2 | 31.38448 | 1.713 | 53.76162 | 3.2 | 53.76162 |
| 0.5 | 4 | 49.48004 | 1.137 | 56.25881 | 4 | 56.25881 |
| 0.5 | 5 | 77.75435 | 0.803 | 62.43675 | 5 | 62.43675 |
| 0.5 | 6.3 | 123.9043 | 0.563 | 69.75813 | 6.3 | 69.75813 |
| 0.5 | 8 | 200.2764 | 0.412 | 82.51386 | 8 | 82.51386 |
| 0.5 | 10 | 313.3736 | 0.256 | 80.22364 | 10 | 80.22364 |
| 0.5 | 13 | 530.1433 | 0.1966 | 104.2262 | 13 | 104.2262 |
| 0.5 | 16 | 803.4616 | 0.1547 | 124.2955 | 16 | 124.2955 |
| 0.5 | 20 | 1255.851 | 0.1176 | 147.688 | 20 | 145.4391 |
| 5 | 20 | 117.8096 | 1.273 | 149.9717 | 20 | 145.4391 |
| 5 | 25 | 188.4954 | 0.931 | 175.4892 | 25 | 170.1854 |
| 5 | 32 | 313.8448 | 0.572 | 179.5192 | 32 | 174.0936 |
| 5 | 40 | 494.8004 | 0.377 | 186.5398 | 40 | 180.902 |
| 5 | 50 | 777.5435 | 0.24 | 186.6104 | 50 | 180.9705 |
| 10 | 50 | 376.9908 | 0.513 | 193.3963 | 50 | 187.5513 |
| 10 | 63 | 607.7406 | 0.317 | 192.6538 | 63 | 186.8312 |
| 10 | 80 | 989.6009 | 0.1845 | 182.5814 | 80 | 177.0632 |
| 10 | 100 | 1555.087 | 0.0958 | 148.9773 | 100 | 144.4748 |
| 10 | 130 | 2638.936 | 0.0589 | 155.4333 | 130 | 150.7356 |
| 10 | 160 | 4005.527 | 0.033 | 132.1824 | 160 | 128.1874 |
| 10 | 200 | 6267.472 | 0.01881 | 117.8911 | 200 | 114.3281 |
| 10 | 250 | 9801.761 | 0.00595 | 58.32048 | 250 | 56.55785 |
Geophysical results data interpreted from computer
| Curve No. VES 01 – KUDATE 01 | Formation Thickness (m) | True Resistivity
(ohm m) |
Expected Geological Formation |
| SITE 1 – LOCATED NEARER THE MANYATTA MID OF PLOT AT OLKURARU IN SAIKERI AREA | 0.0 – 0.42
0.42 – 4.30 4.30 – 49.74 49.74 – 139.74 139.74 – 17742.0 OVER 17742.0 |
102
51 263 91 3 40 |
Brown volcanic clays soil with phonolite boulders Tuffs
Fractured Phonolitic lava Highly weathered/Fractured tuffaceous phonolites Highly weathered/Decomposed agglomerates Fresh phonolites |
REMARKS: The site is potential and suitable for borehole drilling and recommended for drilling to depth of 300metres and HIGHLY RECOMMENDED
- Field data Site No 2 at VES 02 – located at lower section ofshamba
Graph and Table for Vertical Electrical Sounding (VES 02) and Geophysical Data Interpretation
| VERTICAL ELECTRICAL SOUNDING (VES) FOR MR KUDATE OLOLCHOLOI NKUKU LOWER SECTION OF THE SHAMBA AT OLKURARU IN AT SAIKERI AREA OF ENTASHART LOCATION WITHIN KAJIADO WEST SUB-COUNTY – VES 02 | ||||||
| MN/2 | AB/2 | k | d V/I | ρ (Resistivity) | AB/2 | ρ (Resistivity) |
| 0.5 | 1.6 | 7.257073 | 15.1 | 109.5818 | 1.6 | 109.5818 |
| 0.5 | 2 | 11.78096 | 6.61 | 77.87216 | 2 | 77.87216 |
| 0.5 | 2.5 | 18.84954 | 3.64 | 68.61233 | 2.5 | 68.61233 |
| 0.5 | 3.2 | 31.38448 | 1.654 | 51.90994 | 3.2 | 51.90994 |
| 0.5 | 4 | 49.48004 | 0.773 | 38.24807 | 4 | 38.24807 |
| 0.5 | 5 | 77.75435 | 0.42 | 32.65683 | 5 | 32.65683 |
| 0.5 | 6.3 | 123.9043 | 0.228 | 28.25018 | 6.3 | 28.25018 |
| 0.5 | 8 | 200.2764 | 0.1091 | 21.85015 | 8 | 21.85015 |
| 0.5 | 10 | 313.3736 | 0.0588 | 18.42637 | 10 | 18.42637 |
| 0.5 | 13 | 530.1433 | 0.0349 | 18.502 | 13 | 18.502 |
| 0.5 | 16 | 803.4616 | 0.0222 | 17.83685 | 16 | 17.83685 |
| 0.5 | 20 | 1255.851 | 0.0164 | 20.59595 | 20 | 20.59595 |
| 5 | 20 | 117.8096 | 0.1971 | 23.22028 | 20 | 20.59595 |
| 5 | 25 | 188.4954 | 0.1273 | 23.99546 | 25 | 21.28352 |
| 5 | 32 | 313.8448 | 0.0903 | 28.34019 | 32 | 25.13721 |
| 5 | 40 | 494.8004 | 0.0565 | 27.95622 | 40 | 24.79664 |
| 5 | 50 | 777.5435 | 0.0411 | 31.95704 | 50 | 28.34529 |
| 10 | 50 | 376.9908 | 0.0957 | 36.07802 | 50 | 28.34529 |
| 10 | 63 | 607.7406 | 0.0529 | 32.14948 | 63 | 25.25877 |
| 10 | 80 | 989.6009 | 0.0371 | 36.71419 | 80 | 28.84511 |
| 10 | 100 | 1555.087 | 0.0265 | 41.20981 | 100 | 32.37717 |
| 10 | 130 | 2638.936 | 0.01716 | 45.28413 | 130 | 35.57823 |
| 10 | 160 | 4005.527 | 0.01233 | 49.38815 | 160 | 38.80262 |
| 10 | 200 | 6267.472 | 0.00781 | 48.94896 | 200 | 38.45756 |
| 10 | 250 | 9801.761 | 0.00511 | 50.087 | 250 | 39.35168 |
| 10 | 320 | 16069.23 | 0.00262 | 42.10139 | 320 | 33.07766 |
Geophysical results data interpreted from computer
| Curve No. VES 02 – KUDATE 02 | Formation Thickness (m) | True
Resistivity (ohm m) |
Expected Geological Formation |
| SITE 2 – LOCATED LOWER SECTION OF SHAMBA AT OLKURARU IN SAIKERI AREA | 0.0 – 0.46
0.46 – 2.21 2.21 – 24.04 24.04 – 26.10 26.10 – 80.05 OVER 80.05 |
411
63 17 127 50 30 |
Brown volcanic clays soil with phonolite boulders Tuffs
Highly weathered/Fractured tuffaceous phonolites Fractured Phonolitic lava Highly weathered/Decomposed agglomerates Highly weathered phonolites |
REMARKS: The site is potential and suitable for borehole drilling and recommended for drilling to depth of 300metres
WATER QUALITY
Determination of groundwater quality
The data on groundwater quality was mostly generated during the time of borehole drilling. Previous studies had water samples taken from a number of existing groundwater sources.
The results indicated that on the basis of chemical water quality, boreholes water is generally suitable for domestic and other usage as for the intended road construction, livestock and domestic.
A number of parameters are used to classify the quality of groundwater and according to Gorell (1958); water is classified as fresh, brackish, saline and brine on the basis of Total Dissolved Solids (TDS).
Classification of Groundwater Quality:
| Item | Type of water | TDS (mg/l) |
| 1. | Fresh | <1,000 |
| 2. | Brackish | 1,000 – 10,000 |
| 3. | Saline | 10,000 – 100,000 |
| 4. | Brine | >100,000 |
Water Quality Considerations
When deposition occurs in a land-locked basin under conditions of semi-aridity, evaporation of the connate water occurs with the consequent precipitation of mineral salts, mainly carbonates, chlorides, and sulphates.These are disseminated throughout the succession with varying degrees of concentration and, being partly soluble, are readily re-dissolved by meteoric groundwater;hence the water derived from these beds is liable to be saline.
Table of Salinity Limits for Groundwater Use
| EC (mS/cm) | TDS (ppm) | Use/Limitation |
| < 2,000 | < 1,500 | Potable water |
| > 2,000 | > 1,500 | Unsuitable for domestic purposes |
| 2,000 – 3,000 | 1,500-2,000 | Generally too salty to drink but still fit for livestock |
| > 3,000 | > 2,000 | Generally unfit for dairy cattle and young cattle |
| > 7,000 | > 4,500 | Unfit for grazing cattle and sheep |
The quality of groundwater in the area is good except for the fluoride which has been detected in some boreholes exceeding the desirable limit of 1.5 parts per million (ppm). Water from several boreholes is of good quality for domestic purposes. Nonetheless, it is advisable that samples of water be obtained from the proposed borehole on testing and is submitted to competent laboratory for full chemical and bacteriological analysis before it is put into use.
Water quality standards vary from country to country and are determined by the intended use. Drinking water standards are based on the toxicity of certain elements such as Lead, Arsenal, Nickel or selenium, while the tolerance levels of infants set Nitrate levels as it causes conditions known as blue baby syndrome as levels exceeding 10mg/l
Table here below provides the World Health Organization (WHO) and Kenya Bureau of Standards (KEBS) guidelines.
| WHO | KEBS | ||
| QUALITY VARIABLE | mg/l (ppm) | Mg/l (ppm) | COMMENTS |
| PH | 6.5-8.5 | 6.5-8.5 | Acidic is dangerous |
| Colour | 15 TCU | Excess colour is repugnant | |
| Turbidity (N.T.U) | 5 | 1.0 max | |
| Total Alkalinity as CaCO3 | No standard | Not specified | |
| Phenolphthalein (CO3) | 0.001 | 0.001 max | |
| Methyl Orange (HCO3) | No standard | Not specified |
| Chloride (Cl) | 250.0 | 250.0 max | |
| Sulphate (SO4) | 400.0 | 400.0 max | Taste, odours, cathartic effects |
| Nitrate (NO3) | 4.5 | 4.5 max | Infant blue baby syndrome |
| Nitrite (NO2) | 1.0 | 1.0 max | |
| Fluoride (F) | 1.5 | 4.0 max | Dental and skeletal fluorisis |
| Sodium (Na)+ | 200.0 | 200 max | Chronic, long term toxic |
| Potassium (K)+ | 200.0 | 200.0 max | No standard |
| Calcium (Ca)++ | 200.0 | 200.0 max | No standard |
| Magnesium (Mg)++ | 50.0 | 50.0 max | May cause diarrhoea in new users |
| Iron (Total) (Fe)+++ | 0.3 | 0.3 max | High concentrations toxic to children |
| Manganese (Mn)++ | 0.05 | 0.05 max | Toxic particularly to aquatic organisms |
| Ammonia – Free & Saline (NH4)+ | 0.5 | 0.5 max | |
| Ammonia-Albuminoid (NH4)+ | 0.5 | 0.5 max | |
| Carbonate Hardness as (CaCo3) | Related to TDS | Not specified | |
| Non-Carbonate Hardness as (CaCo3) | Related to TDS | Not specified | |
| Total Hardness as (CaCo3) | 500.0 | Not specified | |
| Free Carbon Dioxide | 20.0 | 20.0 max | |
| Silica (SiO2) | No standard | Not specified | |
| Oxygen absorbed 4hr at 27°C (P.V.) | 1.0 | 1.0 max | |
| Total Dissolved Solids, residue dried
at 180°C |
1500.0 | 1500.0 max |
CONCLUSIONS ANDRECOMMENDATIONS
Conclusions
Based on the local geology, the geophysical survey results, the hydro-geological conditions and the data of the existing boreholes within the vicinity of the client’s parcel of land, it has been concluded as follows: –
- The area is characterised by two hydro-geological regimes; one associated with fractures and faults running in the north south direction and lavas while the other associated with sediments and lake beds of the Upper Athi
- The proposed site is located between the hills to the south and north. The zone is a recipient of the groundwater recharge from the hills and transmits this recharge to lower elevation through fractures and
- The results of the geophysical survey shows the area has deep weathering to the at the point of survey with most probable the faultzones
- The depth alone is not the determining factor for a high yielding borehole, but properborehole construction and
- The area has good chances of striking water at greater depths, within the Old LandSurface (Highly decomposed phonolites) reddish brown and gravely (large pebbles)
- That the geophysical results do give the true picture of the actual subsurface conditions of the geology of Ngong Hills as the Basement System Rock is very deep to the depth of more than 300metres.
- The water quality in Ngong area is generally soft but slightly turbid coloured water withhigh iron and manganese contents that improves with prolonged
Recommendations
From the foregoing conclusions, it is recommended as follows: –
- A valid Authorization to sink a borehole must be obtained from the relevant WaterResources Authorities (WRA) for drilling to
- A borehole to be drilled at the selected site to a recommended depth of 300 metres belowground level.
- iv) The completed borehole is required to be test-pumped for a minimum period of 24 hours. The purpose of this test is to determine the actual quantity of groundwater that can be abstracted from the borehole, the abstraction capacity of the pump to be installed and the depth at which the pump (submersible) can be installed.
- Sufficient quantity of the water shall be collected and submitted to the nearestcompetent
water testing laboratory to determine the physical, chemical and bacteriological parameters of the water once the borehole is drilled.
- The whole drilling process, especially the boreholes, construction and test pumping are very crucial to the success of the borehole and therefore supervision of the work by an independent and qualified Hydrogeologist is highly recommended during the drilling and construction stages ofthe borehole.
- That the client carries out Environmental Impact Assessment (EIA) of the proposed borehole before drilling commences, in accordancewith section 58 of theEnvironmental
Management and Coordination Act, 1999 (EMCA) that says all policies, plans, programmes and projects specified in the Second Schedule must be subjected to Environmental Impact Assessment (EIA). The project proponents must obtain an EIA license from NEMA before commencing of any such activity.
- The proposed borehole site is known to the Mr Moses Pesi Kudate Tel. 0722375607 and Mr Morris Maja Kudate Tel. 0710466324 sons to the client and approximately indicated on the map sheet and marked on the topographic map sheet148/3.
BOREHOLE DRILLING ANDCOMPLETION
Drilling Technique
Drilling should be carried out using an appropriate tool-either Percussion drilling rig (cable tool), or a combination of both Air/ Hydraulic Rotary method, Down the Hole Hammer (DTH) and reverse circulation method, depending on the geological conditions of an area. Various drilling methods have been developed to suit different geological conditions that range from hard rock formations to completely unconsolidated sediments.
Well Design
The design of the well should ensure that screens are placed against the optimum aquifer zones. An experienced Hydrogoelogist should make the final borehole design construction, which includes casing string, gravel pack, grouting and cementation works design.
Casing and Screens
Selection of casing material is based on water quality, well depth, cost, borehole diameter, and drilling procedure. The types of casings used in water construction are steel, thermoplastic, fibreglass, concrete, and asbestos cement (transited). Steel is used most commonly, but thermoplastic materials can be used especially in areas where groundwater is highly corrosive and wells more than 100 metres deep.
Corrosion resistance, lightweight, relatively low cost, easy installation, and resistance to acid treatment make plastic (PVC) casings desirable for many installations where high strength is not required. Plastic casings must be centred in the borehole before back filling or filter packing is completed.
The selection of screen material is governed by three factors namely, water quality, potential of iron bacteria and strength requirements. Water quality analysis show whether groundwater is corrosive or incrusting or both. It is therefore important to use a well screen fabricated from corrosion – resistant material.
Gravel Pack
The use of a gravel pack is recommended within the aquifer zone, because the aquifer could contain sands or silts which are finer than the screen slot size. An 8” diameter borehole screened at 6” willleave an annular space of approximately 1”, which should be sufficient. Should the slot size chosen be too large, the well will pump sand, thus damaging the pumping plant, and leading to gradual ‘siltation’ of the well. The slot size should be in the order of 1.4mm. The grain size of the gravel pack should be an average of2-4mm.
Well Construction
Once the design has been agreed upon, construction can proceed. In installing screen and casing, centraliser set at 6 metre intervals should be used to ensure centrality within the borehole. This is particularly important for correct insertion of artificial gravel pack all around the screen. After installation, gravel packed sections should be sealed off top and bottom with clay (2m)
Grouting
The remaining annular space up to the depth of 60m should be grouted by either special cement and or bentonite seal off all the unwanted upper aquifers and seepage from sewage leaks and that no surface water at the well head can enter the borehole and cause contamination.
Well Development
Once screen, pack, seals and back-fill have been installed, the well should be developed. Development aims at repairing the damage done to the aquifer during the course of drilling by removing clays materials and other drilling additives from the borehole wells. Secondly, it alters the physical characteristics of the aquifer around the screen and removes fine particles.
The use of air or water jetting, or the use of mechanical plunger, which physically agitates the gravel pack and adjacent aquifer materials, this is an extremely efficient method of developing and cleaning of the wells and is recommended as a means of development.
Well development is an expensive element in the completion of the well but is usually justifiable in the life, greater efficient of the well, it lowers the operational and maintenance cost and gives a more constant discharge.
Well Testing
After development and preliminary tests, a long-duration well test should be carried out. Well tests have to be carried out on all newly-completed wells, because apart from giving an indication of the quality of drilling, design and development, but it also yields information on aquifer parameters which are vital to the Hydrogeologist. A well test consists of pumping a well from a measured start level (SWL) at a known or measured yield, and recording the rate and pattern by which the water level within the well changes. Once dynamic water level has been reached, the rate of in-flow into the well equals to the rate of pumping. Towards the end of the test, the water sample of at least two litres should be collected for both full chemical analysis and bacteriological analysis.
The duration of the test should be 24 hours, with a further 24 hours for recovery test (during which the rate of recovery is recorded). The results of the test enables the engineer to calculate the best pumping equipment to installed into the borehole, by determining the discharge rate, draw down and the depth of pump intake.
Well maintenance
Once the well has been installed with the right pumping equipment at the right borehole depth and has been commissioned the maintenance schedule should be established. Checks on discharge and static water levels should be part of regular and routine process. This should enable the evaluation of all known conditions should reduction in the yield or other problems occur in future, and recommend the most appropriate action.


DOKUMENTS:
Hydrogeological Report:
Quotations:
Quotation No.1:
Qutation No.2: